

The UK stolen car recovery rate sits at roughly 13.35% across the 2022 to 2025 period, based on 45,195 vehicles recovered out of 342,496 reported stolen. That’s the headline. But that national figure hides a gap that matters far more to you as an individual owner: vehicles fitted with a monitored tracking system are recovered at rates reported as high as 95% by industry data, against a national average sitting closer to a quarter of vehicles at best.
The Office for National Statistics, the Crime Survey for England and Wales, Thatcham Research, and Police.uk all feed into how these figures get calculated, and they don’t always agree with each other. That’s not a flaw in the data. It reflects the fact that “stolen” and “recovered” get measured differently depending on whether you’re counting police reports, insurance claims, or survey responses.
Here’s what the numbers tell you in practice:
- Roughly 1 in 7 to 1 in 4 stolen cars gets returned to its owner nationally, depending on which dataset and year you use.
- A car fitted with an insurance-approved monitored tracker faces dramatically better odds, with some reports citing 50% of tracked vehicles recovered within four hours.
- Where you live and what you drive change your odds substantially before you even factor in a tracker.
Table of Contents
- What is the current stolen car recovery rate in the UK?
- Quick UK statistics snapshot: theft and recovery by year
- Why recovery rates rise and fall: crime trends and root causes
- How much a tracker changes your odds
- Which cars and areas face the highest theft risk?
- What actually changes your personal recovery odds
- Steps that improve your chances before, during, and after a theft
- Where these figures come from and their limitations
- Why we think trackers are the variable worth controlling
- What Thatcham-approved tracking actually gets you
- Sources
- FAQ
What is the current stolen car recovery rate in the UK?
The multi-year average recovery rate across 2022 to 2025 works out to approximately 13.35%, calculated from 45,195 vehicles recovered against 342,496 stolen over that period. That figure comes from police-recorded theft and recovery data aggregated across the four years, which smooths out year-to-year noise but also means it lags slightly behind the most recent single-year snapshot.
More recent survey-based figures tell a slightly different story. The Crime Survey for England and Wales recorded 25.6% of stolen vehicles returned to their owners in 2024 to 2025, the lowest figure in that particular dataset’s run but still notably higher than the four-year police-recorded average. Why the difference? CSEW asks victims directly whether their vehicle came back, while police-recorded statistics track formal case closures, which can lag well behind the actual return of a car to its owner.
Either way you cut it, the national picture is sobering for anyone without additional protection. A car with no tracking device, reported through standard channels, has meaningfully worse odds of coming home than the marketing language around “car theft” might suggest.
Quick UK statistics snapshot: theft and recovery by year
Here’s how the scale of the problem and its outcomes have shifted recently, drawing on police data, CSEW figures, and industry reporting from Statista’s motor vehicle theft series for England and Wales.
- 2022 to 2025 combined: 342,496 vehicles reported stolen, 45,195 recovered, giving the 13.35% multi-year average.
- 2024 to 2025: CSEW reports 25.6% of stolen vehicles returned to owners, the lowest point in that particular series.
- 2025: Industry reporting cites a 55% year-on-year increase in joint monitoring-centre and police recoveries, alongside a total recovered-vehicle value of £41.3 million for the year.
- London specifically: some Freedom of Information figures put recovery performance as high as 50.2%, roughly double the national CSEW figure.
The most important takeaway from this snapshot isn’t any single percentage. It’s that recovery rates vary wildly depending on measurement method, location, and year, which is precisely why owners need a personal strategy rather than relying on national averages to protect them.
Why recovery rates rise and fall: crime trends and root causes
Recovery rates don’t move on their own. They shift because the methods thieves use and the resources police can throw at chasing them change year to year.
Keyless relay theft remains one of the most damaging techniques for recovery odds. Criminals use signal-boosting devices to trick a car into thinking its key fob is nearby, unlocking and starting the vehicle without ever touching the physical key. Because this method leaves no forced-entry evidence and can happen in under a minute, it gives thieves a head start that standard alarms and immobilisers can’t counter.
Cloning involves fitting a stolen vehicle with false number plates matching a legitimate car of the same make and model, sometimes accompanied by forged documentation. A cloned vehicle can pass casual ANPR checks and sit on the road, or even get resold, before anyone notices the discrepancy.
Organised export is arguably the biggest threat to recovery odds specifically. Once a stolen vehicle reaches a shipping container or crosses a border, the practical odds of getting it back collapse. Criminal networks that specialise in export work fast, often moving a vehicle out of the country within days.
Stripping for parts destroys any prospect of recovering the whole vehicle, even when police locate the shell. High-demand parts, particularly for popular models, get removed and sold individually, which is often more profitable and lower-risk for thieves than trying to sell or export an intact car.
Behind these methods sit systemic factors that shape how quickly police can respond:
- ANPR camera density varies enormously by force area, and denser coverage in cities like London correlates with the higher recovery rates reported there.
- Police resourcing for vehicle crime competes with other priorities, and investigation time per case has a direct bearing on whether a car gets found before it’s processed, stripped, or exported.
- The “processing window” criminals operate within, often just hours, means recovery speed depends heavily on how fast a location can be established and acted upon.
Overall theft volumes have shown signs of easing in some recent years, while recovery performance in well-resourced areas has improved somewhat. Both trends point the same direction: technology and policing resource concentration matter more than ever.
How much a tracker changes your odds
This is where the numbers stop being abstract and start being genuinely useful for a decision you can make today. Industry data on monitored tracking systems reports recovery rates around 95%, with a significant portion of tracked vehicles recovered within hours and around 80% within 24 hours. Compare that with a national average that struggles to clear a quarter of stolen vehicles, and the gap is not subtle.

| Vehicle protection status | Reported recovery outcome |
|---|---|
| No tracking device (national average) | Around 13.35% multi-year average; 25.6% in CSEW’s 2024–25 survey |
| Monitored tracker fitted | Around 95% recovery reported by industry data |
| Monitored tracker, fast response | Roughly 50% recovered within four hours, 80% within 24 hours |
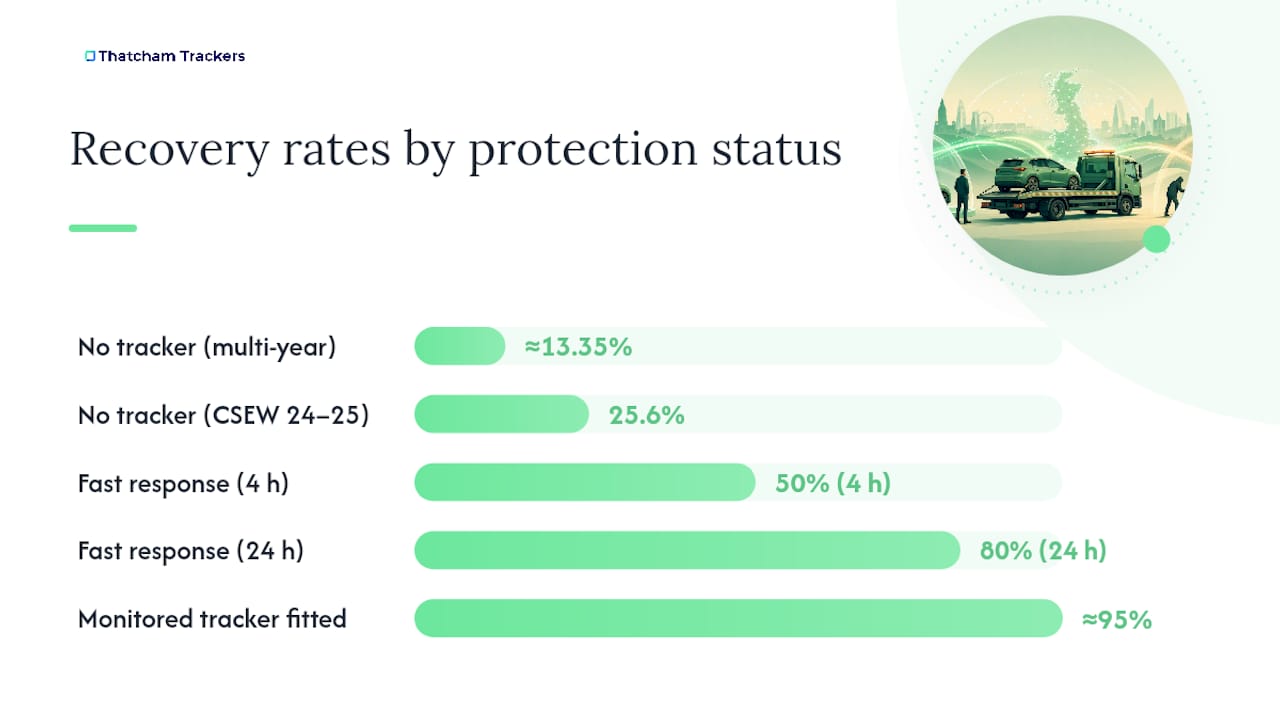
Part of that gap comes down to selection bias worth being honest about. Owners who fit monitored trackers often drive higher-value vehicles or face insurer requirements to do so, which may mean they’re already a somewhat different population than the national average. Even accounting for that, the mechanism behind the gap is straightforward: a monitored system gives police a live location before a vehicle gets cloned, stripped, or shipped out, closing the “processing window” that criminals depend on.
Not all tracking technology works identically. GPS-based systems are excellent for open-air tracking but can lose signal inside metal shipping containers or underground car parks, precisely where organised theft rings try to hide vehicles during export. VHF-based monitored solutions retain signal in these scenarios, which is why the highest-specification insurance-approved trackers often combine both technologies rather than relying on GPS alone. You can read more about the technical differences between GPS and VHF systems if you want the fuller picture.
Pro Tip: Keep your tracker’s Thatcham certificate and installation confirmation somewhere you can access quickly, ideally photographed on your phone. Insurers and police both ask for this documentation, and producing it fast during a claim or an active theft investigation saves time you don’t have to spare.
Which cars and areas face the highest theft risk?
Not every vehicle or postcode carries the same risk, and knowing where you sit on that spectrum helps you judge how much additional protection makes sense.
- Land Rover and Range Rover models remain frequent targets due to strong parts demand and export value, particularly for older models with known keyless vulnerabilities.
- BMW models, especially higher trims, attract thieves for both resale and parts stripping.
- Mercedes-Benz models face similar pressure, with keyless entry systems a recurring weak point.
- Ford Fiesta and Focus, despite lower individual value, are stolen in high volumes simply because of how common they are on UK roads, making parts easy to move.
- Audi models with keyless technology see comparable relay-theft exposure to BMW and Mercedes.
- Vans and light commercial vehicles are increasingly targeted for both the vehicle itself and tools left inside, a growing concern for tradespeople.
Regional concentration matters just as much as the model you drive. London consistently reports higher theft volumes but, notably, also higher recovery rates thanks to denser ANPR coverage and concentrated policing resource, with some figures suggesting recovery performance roughly double the national CSEW average. The West Midlands and other high-incidence force areas show elevated theft counts without always matching that recovery uplift, which tells you resourcing, not just incident volume, drives outcomes. Scotland’s recorded crime data shows a distinct national pattern worth checking separately if you’re based north of the border, since force structures and reporting differ from England and Wales.
If your model appears on a most-targeted list and you live in or near a high-incidence area, that combination is a genuine signal to take additional protection seriously rather than a coincidence to shrug off.
What actually changes your personal recovery odds
National statistics describe averages. Your actual odds depend on a handful of factors you have real control over, ranked roughly by how much influence they carry.
- Whether you have a monitored tracker fitted. This is the single biggest lever available to an individual owner, given the gap between tracked and untracked recovery outcomes discussed above.
- How fast you report the theft. Every hour that passes before police and any monitoring centre are notified is an hour a vehicle can be moved, cloned, or loaded for export.
- Where the vehicle was parked. A car stolen from a driveway with a doorbell camera behaves very differently in an investigation than one taken from an unmonitored street or car park.
- Vehicle configuration and security features. Steering locks, immobilisers, and tamper alerts all add friction that can slow a theft down enough for other measures to catch up.
- Insurance and registration status. Vehicles with clear ownership records and active insurance tend to move through police systems faster, since there’s less ambiguity to resolve before officers act.
Picture two owners with identical cars parked on the same street. One has a monitored tracker and notices a tamper alert on their phone within minutes, calling both the monitoring centre and police immediately. The other has no tracker and only discovers the theft the next morning. The first owner’s car has a realistic shot at being located within hours. The second is now competing against a criminal network that may already have the vehicle stripped or halfway through export.
Fleet and commercial vehicles often see somewhat better recovery outcomes than private cars, largely because fleet operators are more likely to fit trackers as standard, monitor vehicles centrally, and report anomalies faster through dedicated systems rather than relying on an individual noticing something’s wrong.
Steps that improve your chances before, during, and after a theft
Before a theft happens:
- Fit a Thatcham-approved tracker matched to your insurer’s required category, and check whether your policy specifies S5, S5+, or S7.
- Keep your digital certificate and installation paperwork stored somewhere accessible, not just filed away in a drawer.
- Consider pairing a tracker with an immobiliser to add a physical barrier alongside location tracking.
- Set up tamper alerts so you’re notified the moment something interferes with your vehicle’s system, not hours later.
- Where practical, park in view of CCTV or a dashcam-equipped area, and note down anything unusual near your vehicle beforehand.
During a theft or immediately after discovering one:
- Call the police straight away and provide your registration, make, model, and colour without delay.
- Contact your tracker’s monitoring centre in parallel, since monitoring-centre and police collaboration is repeatedly credited with faster recoveries.
- Give police your tracker certificate reference and any live location data the monitoring centre can share.
After the theft:
- Follow up with your insurer promptly, providing the tracker certificate as proof of the fitted device.
- Keep a written log of who you spoke to and when, both at the monitoring centre and with police, in case you need it for a claim or an update request.
- If the vehicle isn’t recovered within the first 24 to 48 hours, ask your insurer what their timeline is for processing a total loss claim.
Pro Tip: Ask your monitoring centre in advance exactly what data they’ll hand to police during an active theft, and in what format. Knowing this before you ever need it means you won’t waste critical minutes explaining your own system to an officer during an emergency call.
Where these figures come from and their limitations
Every statistic in this article traces back to one of a small number of sources, and knowing which is which helps you judge how much weight to put on any given number.
- The ONS ‘nature of crime’ dataset draws on CSEW survey responses, capturing victim-reported outcomes including whether a vehicle was returned.
- Police-recorded crime figures track formal case data, including thefts reported and cases closed, which is where the 342,496 stolen and 45,195 recovered figures for 2022 to 2025 originate.
- Industry press aggregates, including reporting on monitoring-centre and police joint recoveries, add detail that official statistics don’t always capture, such as the £41.3 million recovered-vehicle value figure for 2025.
Two caveats matter here. First, CSEW and police-recorded figures measure different things: CSEW captures victim experience through surveys, while police data reflects formal reporting and case status, and the two don’t always move in step. That’s part of why the CSEW’s 25.6% for 2024 to 2025 sits higher than the four-year police-recorded average of 13.35%. Second, comparing tracked-vehicle recovery rates against the national untracked average isn’t a clean apples-to-apples exercise, since owners who fit monitored trackers may already differ from the general population in vehicle value or insurer obligations. The direction of the gap is real. The exact size of it deserves a pinch of caution.
Why we think trackers are the variable worth controlling
National theft trends are largely outside any individual owner’s control. You can’t change ANPR density in your police force area or how fast organised crime moves stolen cars across borders. What you can control is whether your vehicle carries a monitored tracking system, and the recovery-rate gap between tracked and untracked vehicles is the clearest piece of evidence we’ve seen that this decision matters more than almost anything else on the checklist.
Thatcham Research’s role here deserves more attention than it usually gets. It doesn’t just rubber-stamp products. It independently tests tracking systems against defined performance standards before certifying them, which is why insurers lean on Thatcham approval when setting premiums and, in many cases, when requiring a device at all. That testing process is also why the certificate itself, not just the hardware, carries weight with both insurers and police during an active case.
We’ve seen how monitoring-centre and police collaboration accelerates recoveries when the systems and the paperwork are in place before a theft happens, not scrambled together afterwards. If you’re weighing up whether a tracker is worth the outlay, that’s the practical answer: it’s the one factor in this entire picture you get to decide for yourself.
What Thatcham-approved tracking actually gets you
If you’ve read this far, you already know the gap between a tracked and untracked vehicle isn’t marginal. Thatcham Trackers supplies the certified hardware that closes that gap, built around the exact categories UK insurers ask for.
The S5 tracker meets the baseline most insurers accept for reduced premiums, combining GPS location with monitoring-centre support. The S7 adds driver recognition, useful if you want to distinguish authorised use from theft automatically, and suits higher-value vehicles where insurers often mandate the stricter category. The S5+ sits between the two, layering additional features onto the S5 standard for owners who want more without stepping up to S7 requirements. Every device comes with the mandatory digital certificate insurers require on file, nationwide mobile installation rather than a workshop visit, and full compatibility with 24/7 monitoring so a theft triggers an alert immediately rather than after the fact.
If your policy specifies a tracker category, or you simply want the strongest odds of getting your car back, browse the full range of Thatcham-approved trackers and check which model matches your vehicle and insurer requirements, or head to the S7 collection directly if you need the highest approved tier. Installation can be booked alongside your order, so you can go from browsing to certified and monitored in one appointment.
Sources
- 342000 cars stolen in four years - the UK’s vehicle theft crisis
- Car theft statistics in the UK
- Nature of crime: vehicle-related theft (ONS dataset)
- Stolen vehicles worth £41.3m recovered | vehicle theft
- Motor vehicle theft in England and Wales — Statista
FAQ
How many stolen cars are recovered in the UK?
Roughly 45,195 vehicles were recovered out of 342,496 reported stolen between 2022 and 2025, a multi-year average of about 13.35%.
What are the odds of recovering a stolen car?
Nationally, your odds sit somewhere between roughly 1 in 7 and 1 in 4, depending on whether you use the multi-year police-recorded average or the latest CSEW survey figure. With a monitored, Thatcham-approved tracker fitted, industry data reports recovery rates as high as 95%.
What are the chances of finding a stolen car in the UK if it has a tracker?
Monitored tracking systems report recovery rates around 95%, with roughly half of vehicles recovered within four hours and around 80% within 24 hours, according to industry-reported data. That’s a substantially better outcome than the national untracked average.
What are the current statistics for stolen cars in the UK?
Between 2022 and 2025, 342,496 vehicles were reported stolen with 45,195 recovered. In 2025, industry reporting cited a 55% rise in joint monitoring-centre and police recoveries and £41.3 million in recovered vehicle value for that year.
Does a Thatcham-approved tracker guarantee my car will be recovered?
No tracker can guarantee recovery, but Thatcham-approved, monitored systems significantly improve the odds compared with the national average, and insurers recognise this by requiring or discounting for certified devices like those Thatcham Trackers supplies.