

Around 617,000 vehicle-related theft incidents were recorded across England and Wales in the year ending September 2025, a 16% fall on the previous year according to the Office for National Statistics. Within that figure, insurer data suggests roughly one van is stolen every 55 minutes in the UK. Fewer than half of stolen vans are ever recovered, and tradespeople and small businesses carry the heaviest losses, both in vehicle value and in stolen tools.
TL;DR:
- The majority of stolen vans are Ford Transits, largely because they are the most common on the road, with white vans being stolen most often due to their trade-default color.
- Thieves tend to target urban areas and logistics corridors, especially during autumn and winter, with seasonal peaks increasing overnight theft risks.
- Most victims face full replacement costs as only a minority of stolen vans and tools are recovered quickly, emphasizing the importance of advanced security measures.
- Installing a Thatcham-approved tracker and securing tools separately are key steps to improve recovery chances and reduce van theft risks.
Table of Contents
- Van theft statistics: the key figures at a glance
- Why the numbers move: trends, seasons and reporting gaps
- Which vans, colours and areas face the highest risk?
- The real cost: lost tools, lost days, and low recovery odds
- Practical steps that actually cut van theft risk
- Why Thatcham Research certification matters for recovery
- Where these figures come from and their limits
- What fleet managers should prioritise now
- Reduce your van’s theft risk with certified protection
- Verified sources for these figures
- Sources
- FAQ
Van theft statistics: the key figures at a glance
The headline direction is positive nationally, but van-specific numbers tell a sharper story. Direct Line’s van theft report recorded 11,273 vans stolen across the UK in 2024, working out to roughly 31 vans a day. The insurer estimated the combined value of those stolen vehicles in the hundreds of millions of pounds, and recovery rates were low, with fewer than four in ten vans recovered.
Wider press analysis citing Direct Line and DVLA-derived figures puts 2024/2025 totals somewhere between 9,500 and 11,000 vans, depending on which dataset and time window is used. That range matters for anyone trying to compare year on year.
| Year | Estimated vans stolen | Source |
|---|---|---|
| — | Data included in ONS vehicle-related theft dataset (year to March 2024) | ONS |
| 2024 | 11,273 (insurer count) | Direct Line |
| 2025 | ~617,000 vehicle-related theft incidents overall, down 16% year on year | ONS |
A few things stand out from these numbers:
- Insurer counts and police-recorded totals rarely match exactly, because they measure different populations of claims and reports.
- The overall vehicle-theft trend is falling, but that doesn’t mean van-specific risk is falling at the same pace.
- Estimated financial losses run into hundreds of millions of pounds once stolen tools are added to vehicle value.
Why the numbers move: trends, seasons and reporting gaps
Vehicle-related theft fell 16% in the year to September 2025 compared with the year before, according to the ONS bulletin. That’s a genuinely encouraging national signal. But a national fall doesn’t guarantee your postcode, or your van model, is safer this year than last.
Three things explain why one source’s figure never quite matches another’s:
- The Crime Survey for England and Wales estimates incidents by asking a representative sample of the public, while police-recorded crime only counts what’s actually reported. Underreporting skews both.
- Insurer datasets like Direct Line’s only capture claims that clear an excess threshold, so minor thefts or uninsured losses never appear in their totals.
- Seasonality plays a real role. Darker evenings and Christmas stock loads tend to push theft higher in the autumn and winter months, so a van left overnight in November carries different exposure to one parked in June.
Tradespeople scheduling overnight parking, especially near job sites in unfamiliar areas, should treat winter months as higher risk by default.
Which vans, colours and areas face the highest risk?
Ford Transit variants dominate theft league tables, but that’s partly a numbers game: Transits are the best selling van in the UK, so there are simply more of them on the road to steal. Popularity, not just desirability, drives volume.
Colour matters more than most owners expect. White vans are stolen disproportionately more often than any other colour, largely because they’re the trade default and blend into commercial traffic without attracting a second glance.
Regional hotspots follow population density and van concentration rather than any single “crime capital” pattern. Analysis of police-force-level reports by Vanarama shows theft concentrated around major urban and logistics corridors, including the London and Manchester car theft statistics regions, where high van density and heavy commercial traffic create more targets in a smaller area.
Worth remembering:
- High theft volume in a city often reflects vehicle density, not necessarily a higher per-vehicle risk.
- Rural areas with fewer vans can still see sharp spikes when organised gangs target specific trades.
- Postcode-level comparisons are more useful than blanket regional labels for judging your own exposure.
The real cost: lost tools, lost days, and low recovery odds
Statistic to remember: only around 39% of stolen vans were recovered in Direct Line’s 2024 analysis, leaving the majority of victims facing a full replacement cost on top of any excess.
For self-employed tradespeople, a stolen van rarely means just the vehicle. Tools stored inside are frequently taken alongside it, and replacing a van, insurance excess, and a full kit of tools at once can put a small operation out of action for weeks. Survey-based industry estimates consistently point to daily earnings losses running into hundreds of pounds while a replacement vehicle is sourced and refitted.
Practical steps that actually cut van theft risk
Layered security beats any single measure. Criminals increasingly use relay devices and signal amplifiers to defeat basic locks, so physical deterrents alone rarely stop a determined thief targeting a specific van.
- Park defensively. Reverse into a driveway or wall so rear doors can’t be forced open, and use secure, well-lit compounds overnight where possible.
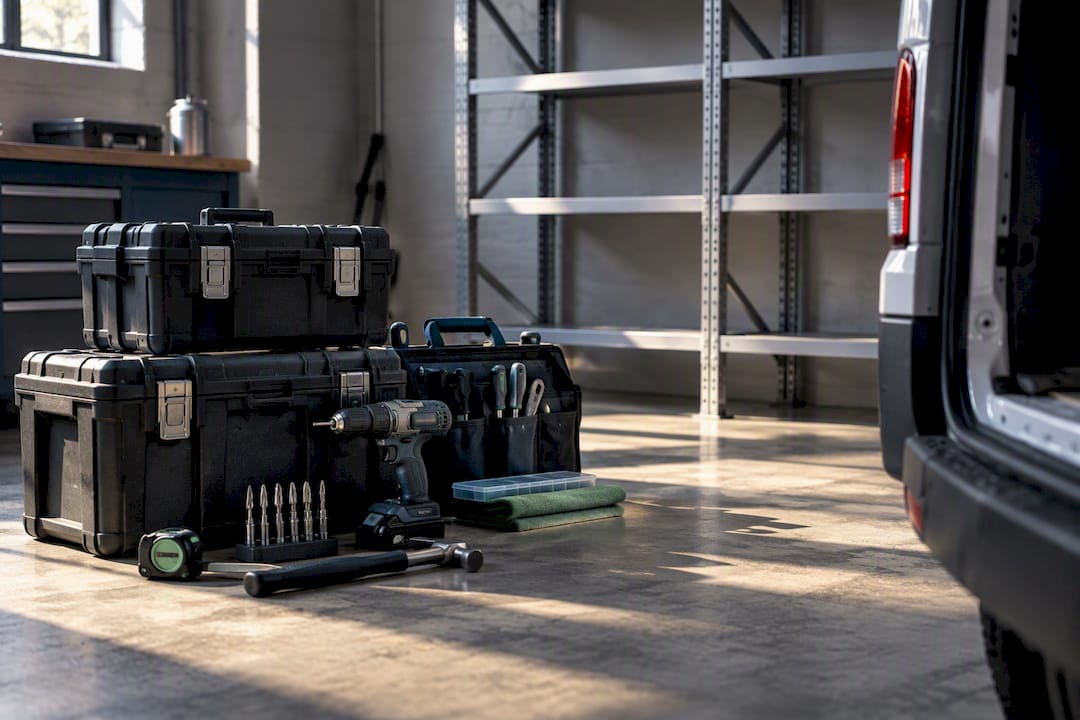
- Lock down tools separately. Fit a tool safe, security grille, or van vault so tools can’t simply be lifted out even if the van itself is entered.
- Fit certified electronics. A Thatcham-approved tracker paired with an immobiliser gives you both a fighting chance of recovery and a device insurers recognise.
- Keep an inventory. Photograph and log serial numbers on tools and equipment, and consider forensic marking so recovered items can be traced back to you.
- Report fast. Notify police and your insurer immediately, since early reporting improves recovery odds and keeps your claim straightforward.
Pro Tip: Combine a tracker with a ghost-style immobiliser rather than relying on either alone. A tracker helps recovery after the fact; an immobiliser stops the van being driven away in the first place. Together, they close the gap that relay attacks exploit. Our immobiliser and tracker combination guide explains how the two work together.
Why Thatcham Research certification matters for recovery
Thatcham Research is the UK’s independent automotive risk body. It tests and certifies vehicle security devices, including trackers and immobilisers, against defined performance standards before awarding approval.
- Certification tests cover tamper resistance, monitoring reliability, and immobilisation performance under real-world conditions.
- Insurers rely on Thatcham Research’s ratings when deciding whether to require a device, or reward one with a lower premium.
- Publisher evidence indicates certified trackers materially improve the odds of recovering a stolen vehicle compared with uncertified aftermarket devices.
Certification is not a guarantee against theft. It’s a recognised standard that insurers trust, and one that gives investigators a working chance of tracing a van once it’s gone. Our car theft prevention and tracker strategy guide covers how these devices perform in practice.
Where these figures come from and their limits
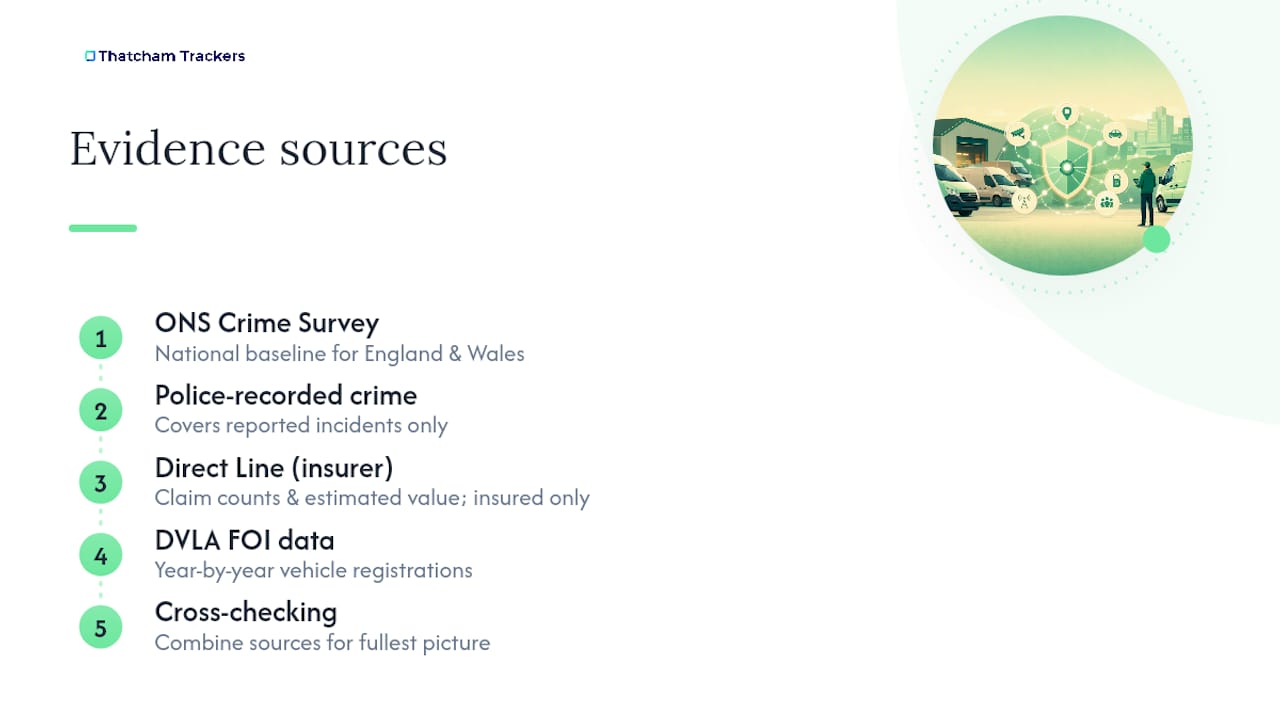
The ONS Crime Survey and police-recorded crime figures form the national baseline, updated roughly twice yearly and covering England and Wales specifically. Police-recorded totals depend on what victims actually report, while survey data captures incidents that may never reach a police station.
Insurer figures from Direct Line add commercial detail national statistics can’t, model-level theft counts and estimated financial value, but only for insured claims above an excess threshold. DVLA-linked Freedom of Information requests fill some of the gap with year-by-year registration data. Cross-checking all three gives the fullest picture; relying on one alone risks missing the trend entirely.
What fleet managers should prioritise now
Falling national theft figures mask a persistent, targeted risk for van operators specifically. If you run a fleet or a single work van, the two priorities are simple: fit a certified tracker before anything else, and stop treating tool storage as an afterthought.
— Thatcham Trackers
Reduce your van’s theft risk with certified protection
Fitting a Thatcham-approved tracker is one of the few measures that does double duty: it satisfies insurer requirements outright and genuinely improves recovery odds if the worst happens. Thatcham Trackers supplies and fits the Thatcham S5 (current prices are on the company’s pricing page), the Thatcham S5 Plus, and the Thatcham S7, covering the full range of insurer-approved specifications for vans, cars, and motorhomes.

For our standard wired trackers, professional fitting is included subject to coverage and availability. Your digital certificate is issued immediately once installation and commissioning are complete. Confirm the exact device, monitoring service and evidence with your insurer. Certification does not guarantee acceptance or a claim outcome.
Verified sources for these figures
- ONS: Nature of crime, vehicle-related theft datasets
- ONS FOI: yearly breakdown of vehicles reported stolen, 2018 to 2025
Sources
Police-recorded crime, the Crime Survey for England and Wales, and insurer datasets like Direct Line’s each measure different populations of theft. Police figures depend on what’s reported, survey data captures wider incidents, and insurer counts only include claims above an excess threshold.
- Nature of crime: vehicle-related theft — datasets (ONS)
- Yearly breakdown of the total number of vehicles reported as stolen in the UK, 2018 to 2025 (ONS FOI page)
FAQ
What is the UK’s most stolen vehicle?
Ford Transit variants top most theft league tables, largely because they’re the best selling van in the UK and simply outnumber every other model on the road. High-value SUVs and keyless-entry cars also feature heavily in wider vehicle theft figures, according to Direct Line’s van theft report.
What are the latest UK vehicle theft statistics?
Vehicle-related theft fell 16% to around 617,000 incidents in the year to September 2025, per the ONS. Van-specific insurer data separately recorded 11,273 vans stolen in 2024, according to Direct Line.
What is the most stolen item from vans in the UK?
Power tools are the most commonly stolen item from vans, often taken alongside the vehicle itself or during smash-and-grab raids on parked vans. Trade-specific kit like drills, saws, and diagnostic equipment carries high resale value and is rarely traceable once removed from its case.
How much does a Thatcham-approved tracker cost?
Our standard wired packages cost £169 for S7, £349 for S5 and £449 for S5 Plus, including professional fitting, plus £10.99/month monitoring. First-year totals are £300.88, £480.88 and £580.88 respectively, excluding optional extras and counting the first monitoring month once. Prices checked on 30 September 2026; fitting is subject to compatibility, coverage and appointment confirmation. See our current cost comparison.